This article was originally written in Japanese and translated into English with AI assistance. Please note that some expressions may carry nuances from the original Japanese.
🇯🇵 日本語版はこちら / Japanese version
Hello — this is Satoshi Kanazawa, of Soul Resonant Works.
We’ve just released a small tool called CubePlot. This post is that announcement. Think of it less as a development diary and more as a simple “it’s out — here’s what it is.”
What it does, in one line: load a CSV you already have, and it becomes a 3D scatter plot you can rotate and zoom. That’s all it does. But building it reminded me how much I’d actually wanted exactly that “all.”
No install, no sign-up
CubePlot runs from a single HTML file.
No installation, no account. Download the HTML file, open it in your browser, and it starts — that’s it. One file to send, one file to receive. It even works offline, with no network connection.
You load a CSV and pick three axes. On top of X/Y/Z, you can attach labels to points, look at a cross-section with the slice view, switch between presets, and export what you see as PNG or CSV. It’s aimed at the “just spin a 3D scatter and take a look” use case that’s a little awkward to do in Excel or a BI tool.
You can also assign fields to the color and size of each point, so with three axes plus color, size, and label you can take in even more at once. (This color- and size-based multidimensional mapping is a feature of the Student and commercial-license versions; the free version gives you 3D display on three axes plus labels.)
Designed so your data never leaves
Generating a beautiful chart is something generative AI is genuinely good at these days. The catch is that many generative-AI services tend to send your data to the cloud to do it. When you’re handling data that must not leave your hands, that’s a problem — one I kept running into myself.
This is the point I most want to get across about CubePlot.
The application itself sends no data anywhere. It uses a browser mechanism (CSP) to block network communication outright, so the CSV you load is never uploaded to a third-party server. Data with confidential or personal information stays entirely inside your own browser.
So that you can confirm “is it really not sending anything out,” we’ve also published a verification page (verify.html). I didn’t want to just say “it’s safe” — I wanted it to be something you can check.
The design philosophy is simply different from cloud-upload-and-visualize tools, and I’d be glad if that one point comes across.
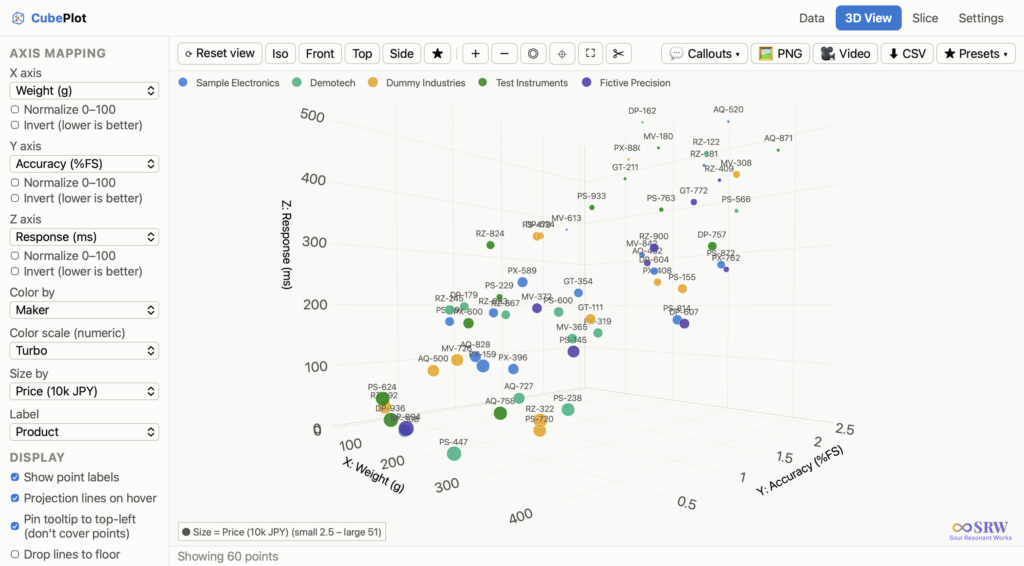
Product comparison, colored by maker
It looks completely different depending on your data
CubePlot is a visualization tool, so what you bring changes its face entirely.
Distribution of measurement data. Terrain elevation. Star maps and the solar system in astronomy. Building heights across a city. I tried a few myself, and it’s hard to believe it’s the same tool — what you see changes that much. When I loaded Mt. Fuji’s elevation data (16,384 points) and spun it, an honest “whoa” came out of me.
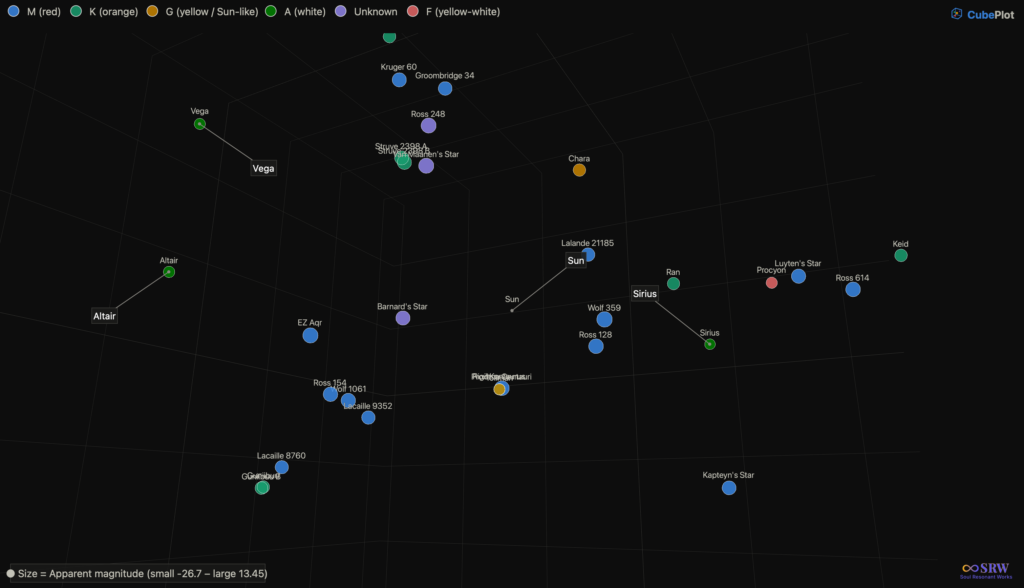
A 3D map of nearby stars centered on the Sun. Summer-sky stars (Vega, Altair) and winter-sky stars (Sirius, Procyon) fall on opposite sides of the Sun — which is why we see them in opposite seasons.
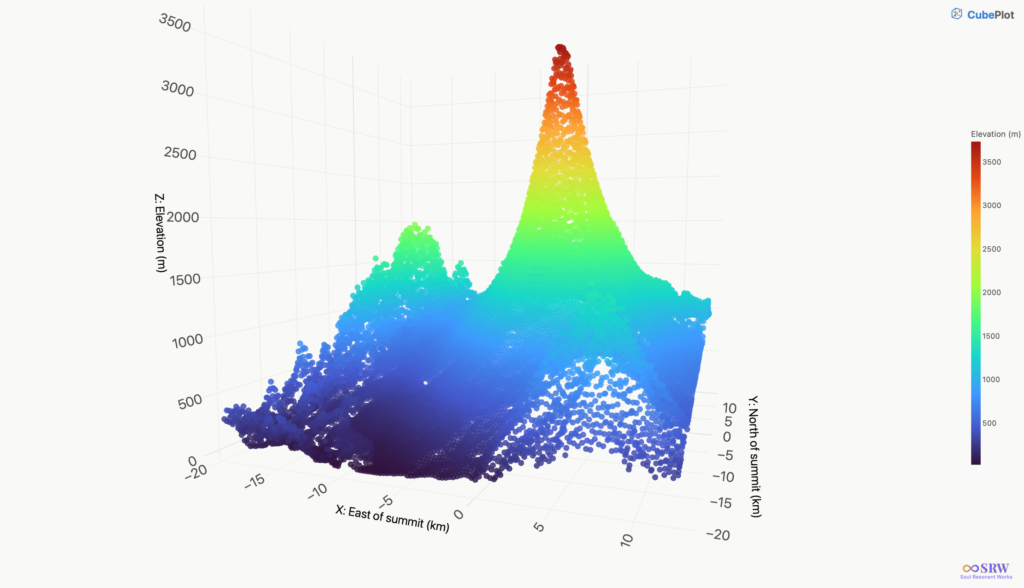
Mt. Fuji terrain, colored by elevation(Light Theme)
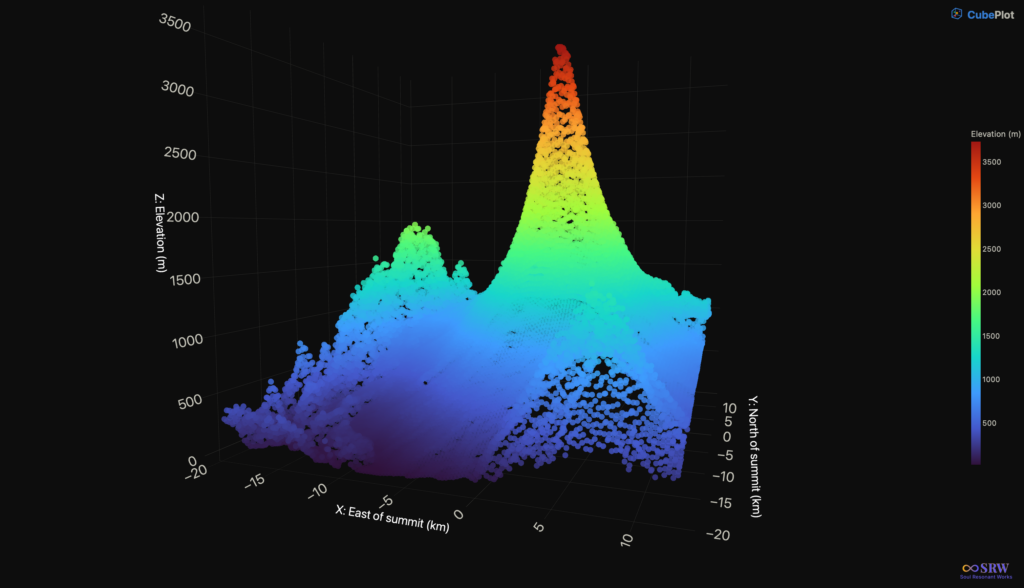
Mt. Fuji terrain, colored by elevation(Dark Theme)
Three ways to get it
CubePlot comes in three forms.
Free. 3D display on X/Y/Z axes, labels, slicing, and PNG/CSV export — free, with no time limit (the screen and exported PNGs carry a watermark and QR code). It’s the version for trying it at zero cost. Note that color- and size-based multidimensional mapping, rotating-video (MP4) export, and watermark-free output are features of the Student and commercial-license versions below.
Commercial license (USD $39 + tax where applicable). The watermark-free commercial version. It adds color- and size-based multidimensional mapping and rotating-video (MP4) export. Sold as a download on Gumroad. The zip includes two builds at the same price — a “no local server” build (default) and a “_with-server” build (optional). The default no-server build is all almost everyone needs. One license covers up to five people in the same organization.
Student. Free, by application. Email student@sr-works.net and we’ll take it from there. If you want to use it for learning, I really want to get it into your hands.
From a small personal itch
It began with my own small problem: “I want to compare more than two parameters at once.”
Think of something like a comparison matrix. With two parameters, a table or chart makes it easy. But once the things you want to compare grow to three or four, it suddenly becomes hard to lay out, and I never found a representation that felt right. Capable tools for multidimensional data do exist — high-end paid software, or well-known libraries that require coding — but for an occasional personal need, the money and the learning curve were honestly hard to justify. In the end I never reached for any of them.
Tired of laying out sheet after sheet of 2D charts to compare, I thought: what if I just put all of it into space at once? That’s where CubePlot came from.
Twenty-five years around theater, zero programming background — from that starting point, this is one more milestone on a path I’ve been shaping through dialogue with AI. I think of it as a continuation of “turning my own problems into something real,” which I wrote about in my first post, “Why I Started Soul Resonant Works.”
To be honest, at Soul Resonant Works I’ve been developing several tools in parallel, and some were started earlier. As it turned out, the first one finished and out the door was CubePlot. It’s the first product Soul Resonant Works is bringing to market. I’ll write more about that story on the development blog going forward.
Whether it turns out useful depends on your data. First, I’d be glad if you’d try the free version and spin one of your own CSVs.
Get it / Contact
- Product page (try the free version / how to buy): https://sr-works.net/en/cubeplot/
- Commercial license (USD $39 + tax where applicable): https://soulworks8.gumroad.com/l/pzcij
- Student version: student@sr-works.net
- Other inquiries: inquiry@sr-works.net (general) / biz@sr-works.net (business)
About Soul Resonant Works
Soul Resonant Works is a solo studio building local-first (everything-stays-on-your-machine) tools. Starting from zero programming background, I develop through dialogue with AI.
🌐 Soul Resonant Works:
→ https://sr-works.net/en/index.html
📝 This blog publishes the entire development process as a serialized journal.
If you found this article useful, please share it.